
Constituent Charting for Discourse Analysis (CiCaDA):
Information Model and Presentation Model
Lars's MA thesis. (The PURL for this page is http://purl.oclc.org/NET/huttar/lars/ma-thesis. Please use it if you link to this page.)
Abstract:
A common task in discourse analysis is the preparation of constituent charts, to make patterns in a text more visible. Domain-specific computer software could make this task easier. But in order for the products of such tools to be shareable and reusable in the long term, the tools must be designed to separate information from presentation, and meet certain other portability requirements (see Bird and Simons 2003).
This thesis demonstrates such a design, using XML documents to encode the information and a DTD to specify the information model. An XSLT stylesheet, representing the presentation model, is used to generate display charts (presentation forms) from abstract charts (representations of the information in a constituent chart, without regard to presentation format). The information model and presentation model are then shown to be adequate for most constituent charts by encoding three example charts, and then generating presentation forms from them that are accepted as adequate by the authors of the original charts. Consideration is also given to generating abstract charts from annotated texts via stylesheets.
Keywords:
discourse analysis, constituent chart, linguistic annotation, information model, presentation model, XML, XSL, XSLTDownloads:
- Thesis defense presentation, as ZIP archive of Powerpoint file (302KB)
- Thesis:
- as ZIP archive of MS Word .doc file (2 MB)
- as PDF file (1.9 MB)
- XML, XSL, and associated files in ZIP archive. (I use Saxon 6.5.2 for the XSL processing... you may wish to do the same.)
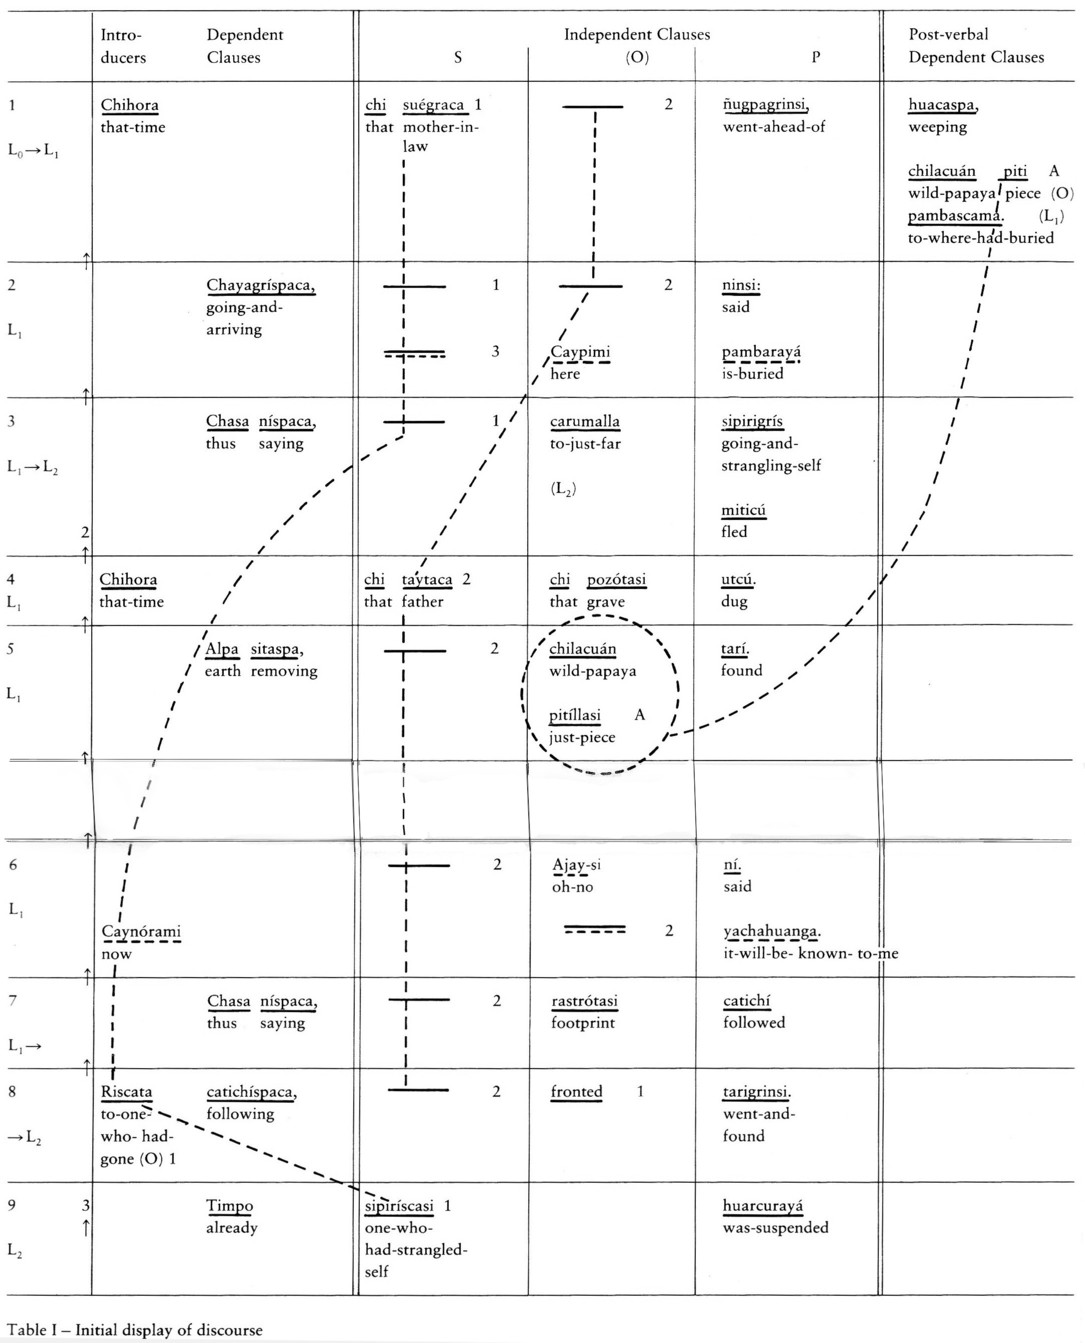
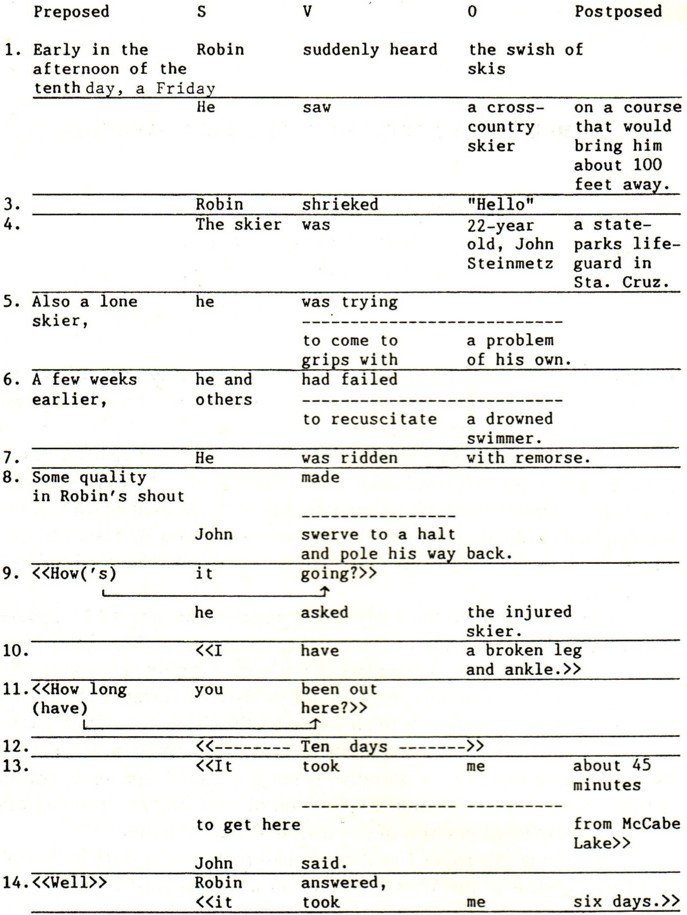
- Original chart images:
- Inga chart (Fig. 3)
- "Ordeal" chart (Fig. 4)
- "Hans" chart (Fig. 5)
- Rendered HTML versions of charts: (these are tested in Internet Explorer
6.0; other browsers may give unexpected results)
- Inga chart (Fig. 20)
- "Ordeal" chart (Fig. 21)
- "Hans" chart (Fig. 22)
Your comments are appreciated.
Related Links:
- SmART, a Semantic Analysis Research Tool that models the text and analytical annotations in XML and renders a chart display using XSLT.
- LTC (Linguistic Tree Constructor) facilitaties hierarchical and other linguistic analysis markup of a text, and can export the result in XML.
|
| Cicada illustration is copyright © by Yasuhiro Maeda. |